How to create a custom gauge control using UIKit
Subclassing UIView is only the first step…
Custom views help give your app a more unique look and feel, and are surprisingly easy to create thanks to the power of UIKit and Core Graphics.
In this article we’re going to demonstrate custom controls by building a gauge control from scratch. There are lots of ways you can build gauge controls, so we’re going to try to add a number of customization points so that end users have control over the way our gauge looks.

SPONSORED Join a FREE crash course for mid/senior iOS devs who want to achieve an expert level of technical and practical skills – it’s the fast track to being a complete senior developer! Hurry up because it'll be available only until April 28th.
Sponsor Hacking with Swift and reach the world's largest Swift community!
Creating the basic shape
Our first step is to create the basic gauge background. So, create a new iOS project in Xcode, using the Single View App template.
Create a new Cocoa Touch Class in there called GaugeView, making it subclass from UIView – that’s where we’ll do all our work. Finally, add this code to the viewDidLoad() method of the ViewController class:
override func viewDidLoad() {
    super.viewDidLoad()

    let test = GaugeView(frame: CGRect(x: 40, y: 40, width: 256, height: 256))
    test.backgroundColor = .clear
    view.addSubview(test)
}
That creates an instance of our gauge and places it on the screen so we can see what we’re working with every step of the way.
You won’t see anything yet, but we’ll fix that straight away: we’re going to give our gauge two bezels plus the main background. The second bezel is useful for creating a depth effect, or just to space the color segments away from the edges.
First, we need to define some properties:
- The color and width of the outer bezel.
- The color and width of the inner bezel.
- The main inside color of the gauge.
We need to make the width values instances of CGFloat because we’ll be using them for Core Graphics calls, but I’m also going to provide some sensible default values for the colors: white on the inside and the inner bezel, and a medium blue for the outer bezel.
Add these properties to GaugeView now:
var outerBezelColor = UIColor(red: 0, green: 0.5, blue: 1, alpha: 1)
var outerBezelWidth: CGFloat = 10

var innerBezelColor = UIColor.white
var innerBezelWidth: CGFloat = 5

var insideColor = UIColor.white
We’ll use those immediately by adding a drawBackground() method that draws the outer bezel, then the inner bezel, then the main body of the gauge as a series of concentric circles. Positioning and measuring the two inner circles can be done by calling insetBy() on our drawing rectangle: once with the outer bezel width, then again with the inner bezel width.
Add this method to GaugeView:
func drawBackground(in rect: CGRect, context ctx: CGContext) {
    // draw the outer bezel as the largest circle
    outerBezelColor.set()
    ctx.fillEllipse(in: rect)

    // move in a little on each edge, then draw the inner bezel
    let innerBezelRect = rect.insetBy(dx: outerBezelWidth, dy: outerBezelWidth)
    innerBezelColor.set()
    ctx.fillEllipse(in: innerBezelRect)

    // finally, move in some more and draw the inside of our gauge
    let insideRect = innerBezelRect.insetBy(dx: innerBezelWidth, dy: innerBezelWidth)
    insideColor.set()
    ctx.fillEllipse(in: insideRect)
}
We can now call that when it’s time for our gauge to draw itself. This is done by implementing the draw() method: it will start by finding the current drawing context, then call all the methods required to draw the gauge. We only have one of those right now, so let’s start there:
override func draw(_ rect: CGRect) {
guard let ctx = UIGraphicsGetCurrentContext() else { return }
drawBackground(in: rect, context: ctx)
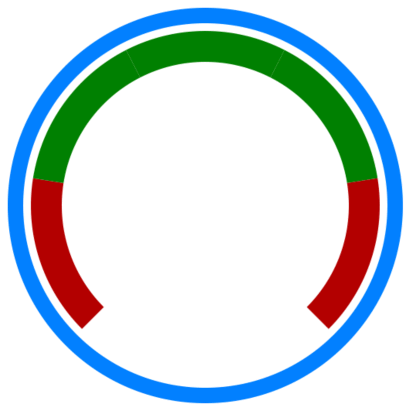
}Go ahead and run the code now and you should see a blue ring. I know it might look pretty simple, but we’ve given users three different customization options and two size options already – they have a lot of control.
Adding gauge segments
Now for the first interesting step: we need to draw some colored segments along our gauge. This will have customizable colors and width, allowing folks to show a range of colors, mostly green then yellow and red at the end, or perhaps no colors at all if that’s the design they want.
Those customization points will be provided by two new properties: a CGFloat called segmentWidth for controlling how thick the gauge colors and drawn, and a UIColor array called segmentColors for controlling how the colors of each segment. I’m going to make mine have red segments at either end with green in the middle – imagine “low pressure”, “just right”, and “high pressure” – and I’m going to set the middle area to have multiple green segments to make it look more realistic.
Add these two properties to GaugeView now:
var segmentWidth: CGFloat = 20
var segmentColors = [UIColor(red: 0.7, green: 0, blue: 0, alpha: 1), UIColor(red: 0, green: 0.5, blue: 0, alpha: 1), UIColor(red: 0, green: 0.5, blue: 0, alpha: 1), UIColor(red: 0, green: 0.5, blue: 0, alpha: 1), UIColor(red: 0.7, green: 0, blue: 0, alpha: 1)]
We’re also going to add two more customization points that control how the whole gauge is drawn:
- Where should the gauge start? Speedometers usually start at about 8pm on a clock face, but stop watches start at 12.
- How far should the gauge reach? Again, speedometers usually reach over to about 4pm.
We’ll store those as two extra properties, so please add these now:
var totalAngle: CGFloat = 270
var rotation: CGFloat = -135
OK, time for some actual code. We’re going to add a drawSegments() method that will draw each segment. This takes quite a few steps, but the most important part is calling addArc() once for each color segment of our gauge.
Here’s what it needs to do:
- Save the current configuration of our drawing context. We’re about to make changes, and we don’t want to pollute what comes next.
- Move our drawing context into the center of our draw rectangle, then rotate it so we’re pointing towards the start of the first segment. Moving like this means we’re draw relative to the center of our rectangle, which makes rotations more natural.
- Tell Core Graphics that we want to draw arcs using the size specified in our
segmentWidthproperty. - Calculate the size of each segment by dividing the total angle of our gauge by the number of segments.
- Calculate the radius of our segment arc. This should be equal to the width of the draw rectangle minus our segment width, then halved. We halve the rectangle width because we want radius not diameter, and we halve the segment width because Core Graphics draws half the line over the radius and half under – we want it all under. Finally, we take away the outer and inner bezel widths.
- Loop over each segment color, drawing one piece of the arc at a time.
- Reset the graphics state to its earlier configuration.
It’s not a massive amount of code, and I’m going to try to break it down nice and small. Before we start, though, I want to add one little helper method that converts an angle from degrees to radians:
func deg2rad(_ number: CGFloat) -> CGFloat {
    return number * .pi / 180
}
You’re welcome to leave your gauge working in radians if you prefer, but I think most folks find it easier to think in degrees so I’ll be converting here.
Here’s the new method, with comments matching the numbers above:
func drawSegments(in rect: CGRect, context ctx: CGContext) {
    // 1: Save the current drawing configuration
    ctx.saveGState()

    // 2: Move to the center of our drawing rectangle and rotate so that we're pointing at the start of the first segment
    ctx.translateBy(x: rect.midX, y: rect.midY)
    ctx.rotate(by: deg2rad(rotation) - (.pi / 2))

    // 3: Set up the user's line width
    ctx.setLineWidth(segmentWidth)

    // 4: Calculate the size of each segment in the total gauge
    let segmentAngle = deg2rad(totalAngle / CGFloat(segmentColors.count))

    // 5: Calculate how wide the segment arcs should be
    let segmentRadius = (((rect.width - segmentWidth) / 2) - outerBezelWidth) - innerBezelWidth

    // 6: Draw each segment
    for (index, segment) in segmentColors.enumerated() {
        // figure out where the segment starts in our arc
        let start = CGFloat(index) * segmentAngle

        // activate its color
        segment.set()

        // add a path for the segment
        ctx.addArc(center: .zero, radius: segmentRadius, startAngle: start, endAngle: start + segmentAngle, clockwise: false)

        // and stroke it using the activated color
        ctx.drawPath(using: .stroke)
    }

    // 7: Reset the graphics state
    ctx.restoreGState()
}
Tip: We need to subtract .pi / 2 from the rotation because Core Graphics measures its angles where zero degrees is directly to the right. Most users are likely to consider 0 degrees to be directly upwards, so we subtract 90 degrees (.pi / 2 in radians) to correct for that.
Now we just need to add a call to that in draw(), after the drawBackground() call:
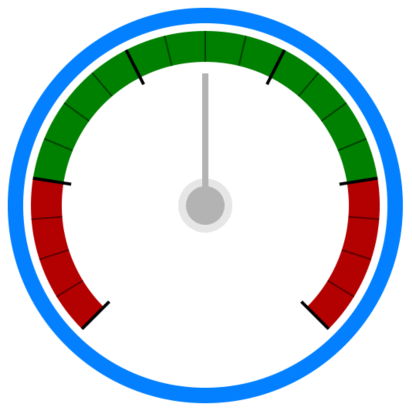
drawSegments(in: rect, context: ctx)If you run the code now you’ll see we now have colored segments inside the blue ring. You’ll also see why the inner bezel is helpful – it adds just a little spacing between the blue ring and the colored segments inside.
Adding tick lines
Now that we have segment bars across our gauge, the next step is to break them up into smaller chunks using tick lines. Again, we’re going to provide lots of customization points so that users can really go to town on configuration their gauge how they want:
- We’ll add major ticks and minor ticks, with major ticks being placed on the boundary between segments and minor ticks inside segments.
- Major ticks have a color, width, and length.
- Minor ticks also have a color, width, and length.
- Minor ticks also have a count – how many minor ticks we want inside each segment.
All those require new properties, so add these to GaugeView now:
var majorTickColor = UIColor.black
var majorTickWidth: CGFloat = 2
var majorTickLength: CGFloat = 25

var minorTickColor = UIColor.black.withAlphaComponent(0.5)
var minorTickWidth: CGFloat = 1
var minorTickLength: CGFloat = 20
var minorTickCount = 3
Once again, I’ve provided sensible defaults that mean users can customize only the bits they care about.
We need to write a third method called drawTicks(), and this is a little bit more complicated again. First let’s fill in the easy bits:
- Save the state of the graphics context so we can restore back to a clean slate.
- Move into the center of our drawing and rotate to the start of the segments
- Calculate the segment angle and radius again.
- Save the state of the graphics context again so we can restore back to the translated/rotated position.
- Leave some space to draw the major ticks.
- Restore the graphics state, then save it again.
- Leave some space to draw the minor ticks.
- Restore the graphics state twice.
The main thing in there is the saving and restoring of graphics state. This might seem like a bit of a hassle, but it’s a sensible way of working: each of our drawing methods start and end with a clean slate so they don’t depend on each other, and the rotation transforms caused by drawing our major tick lines don’t affect drawing our minor tick lines.
Let’s start by writing code for the above. Add this method now:
func drawTicks(in rect: CGRect, context ctx: CGContext) {
    // save our clean graphics state
    ctx.saveGState()
    ctx.translateBy(x: rect.midX, y: rect.midY)
    ctx.rotate(by: deg2rad(rotation) - (.pi / 2))

    let segmentAngle = deg2rad(totalAngle / CGFloat(segmentColors.count))

    let segmentRadius = (((rect.width - segmentWidth) / 2) - outerBezelWidth) - innerBezelWidth

    // save the graphics state where we've moved to the center and rotated towards the start of the first segment
    ctx.saveGState()

    // draw major ticks

    // go back to the state we had before we drew the major ticks
    ctx.restoreGState()

    // save it again, because we're about to draw the minor ticks
    ctx.saveGState()

    // draw minor ticks

    // go back to the graphics state where we've moved to the center and rotated towards the start of the first segment
    ctx.restoreGState()

    // go back to the original graphics state
    ctx.restoreGState()
}
There’s nothing surprising in there, so let’s move swiftly on to the real work: drawing the major and minor tick marks.
Drawing the major tick marks starts by adjusting the line width of our drawing context to match whatever was set in majorTickWidth, then activating the majorTickColor property. Replace the // draw major ticks comment with this:
ctx.setLineWidth(majorTickWidth)
majorTickColor.set()
Next we need to loop over all the segment colors, drawing one major tick for each one. This will actually count from zero up to and including the number of segments, so that each segment starts and ends with a tick.
Now, we need a small amount of mathematics here in order to draw the correct tick line. We already calculated segmentRadius, which is where we draw the colored bars, but remember that Core Graphics draws the segments half way over the radius and half under the radius.
We want our tick marks to end at the far edge of the segments, so we need add half the segment width. As for where the ticks start, we’ll take their end position and subtract the tick length, which will bring them closer to the center of the gauge.
So, add this code below the previous two lines:
let majorEnd = segmentRadius + (segmentWidth / 2)
let majorStart = majorEnd - majorTickLength
Now all that’s left is to loop through all the segments, moving to the start point, adding a line to the end point, stroking it, then rotating so we’re ready to draw the next tick. Add this below the previous lines:
for _ in 0 ... segmentColors.count {
    ctx.move(to: CGPoint(x: majorStart, y: 0))
    ctx.addLine(to: CGPoint(x: majorEnd, y: 0))
    ctx.drawPath(using: .stroke)
    ctx.rotate(by: segmentAngle)
}
Drawing the minor ticks is similar, although we need a little extra mathematics. As before, we need to activate our new line width and color, then calculate the start and end points of the lines, so replace // draw minor ticks with this:
ctx.setLineWidth(minorTickWidth)
minorTickColor.set()

let minorEnd = segmentRadius + (segmentWidth / 2)
let minorStart = minorEnd - minorTickLength
However, this time we also need to figure out how far apart to draw the ticks. Minor ticks are drawn inside each segment, so if users ask for three ticks then we’ll draw three lines equally spaced inside each segment. To make that happen, we’ll divide the segment angle – the total angle for each segment – by minorTickCount plus one.
The “plus one” part is important, because we draw the ticks inside the segments rather than at the ages. For example, if we had a segment angle of 100 and wanted three ticks, dividing 100 by three would place ticks at 33, 66, and 99 – there would be a tick right next to the major tick line at 100. But if we add one and skip the last tick, we get 25, 50, and 75, which divides the segment perfectly.
So, add this line of code next:
let minorTickSize = segmentAngle / CGFloat(minorTickCount + 1)Now for the important part: we loop over all the segments, rotating a little each time, then draw the tick, then rotating again. The second rotation is required so that we don’t draw minor tick marks over the major tick marks by accident.
Add this code next:
for _ in 0 ..< segmentColors.count {
    ctx.rotate(by: minorTickSize)

    for _ in 0 ..< minorTickCount {
        ctx.move(to: CGPoint(x: minorStart, y: 0))
        ctx.addLine(to: CGPoint(x: minorEnd, y: 0))
        ctx.drawPath(using: .stroke)
        ctx.rotate(by: minorTickSize)
    }
}
That completes drawing the tick marks, so now you can go ahead and add a call to drawTicks() to the end of the draw() method, like thisL
drawTicks(in: rect, context: ctx)If you run the code now you’ll see we have most of the gauge drawn now – all that remains is adding some sort of needle and read out on top.

Showing a value
To make the gauge actually useful takes three more steps: creating a needle that points to a specific value, rendering something behind the needle so that it looks like it’s fixed to our gauge, then adding a label that shows the current value.
We’ll tackle those in the order 2, 1, 3, because that order makes sense in terms of the finished product as you’ll see. So, first we’re going to render something in the center of our gauge that the needle will be visually connected to.
To give the user maximum control, we’re going to create four new properties: the width and color of an outer disc, and the width and color of an inner disc. This allows us to make the inner disc the same color as the needle, giving it a pleasing round base, then make the outer disc look like the part attaching it to the gauge.
So, add these four properties to GaugeView:
var outerCenterDiscColor = UIColor(white: 0.9, alpha: 1)
var outerCenterDiscWidth: CGFloat = 35
var innerCenterDiscColor = UIColor(white: 0.7, alpha: 1)
var innerCenterDiscWidth: CGFloat = 25
We’re going to use those four in a new method called drawCenterDisc(). This will save and restore the graphics state as appropriate (always a good idea), move to the center of the rendering area, then draw two ellipses. Add this method now:
func drawCenterDisc(in rect: CGRect, context ctx: CGContext) {
    ctx.saveGState()
    ctx.translateBy(x: rect.midX, y: rect.midY)

    let outerCenterRect = CGRect(x: -outerCenterDiscWidth / 2, y: -outerCenterDiscWidth / 2, width: outerCenterDiscWidth, height: outerCenterDiscWidth)
    outerCenterDiscColor.set()
    ctx.fillEllipse(in: outerCenterRect)

    let innerCenterRect = CGRect(x: -innerCenterDiscWidth / 2, y: -innerCenterDiscWidth / 2, width: innerCenterDiscWidth, height: innerCenterDiscWidth)
    innerCenterDiscColor.set()
    ctx.fillEllipse(in: innerCenterRect)
    ctx.restoreGState()
}
Remember also to add a call to that method in the draw() method:
drawCenterDisc(in: rect, context: ctx)The next step is to add the gauge needle itself. This needs to be something we can move and animate freely, so it’s a smart idea to make a separate UIView for this rather than trying to draw it by hand.
So, start by adding these three properties to GaugeView:
var needleColor = UIColor(white: 0.7, alpha: 1)
var needleWidth: CGFloat = 4
let needle = UIView()
Now we need to make a method that configures the needle and positions it correctly. This is easier said than done: we want the needle to rotate from its bottom edge rather than UIKit’s default center, so we need to adjust the anchor point of its CALayer before we position it. We also need to make sure this set up method gets called from both of the initializers of UIView, because it could be created from code or from a storyboard.
So, first add this setUp() method to GaugeView:
func setUp() {
    needle.backgroundColor = needleColor
    needle.translatesAutoresizingMaskIntoConstraints = false

    // make the needle a third of our height
    needle.bounds = CGRect(x: 0, y: 0, width: needleWidth, height: bounds.height / 3)

    // align it so that it is positioned and rotated from the bottom center
    needle.layer.anchorPoint = CGPoint(x: 0.5, y: 1)

    // now center the needle over our center point
    needle.center = CGPoint(x: bounds.midX, y: bounds.midY)
    addSubview(needle)
}
We can then add both initializers for the view, each time calling setUp():
override init(frame: CGRect) {
    super.init(frame: frame)
    setUp()
}

required init?(coder aDecoder: NSCoder) {
    super.init(coder: aDecoder)
    setUp()
}
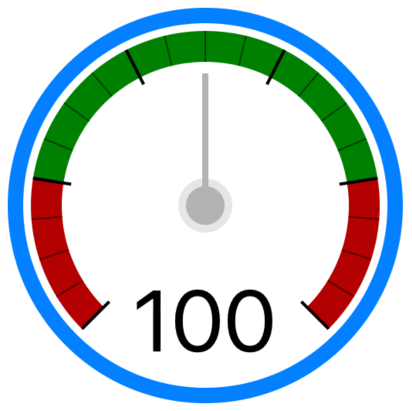
Finally, we need to add a UILabel to show the actual value of the gauge. Again, we need to expose some customization points for color and font, so add these properties to GaugeView:
let valueLabel = UILabel()
var valueFont = UIFont.systemFont(ofSize: 56)
var valueColor = UIColor.black
Just like the needle, we need to configure valueLabel when setUp() is called. So, add this code to the setUp() method so the label is positioned at the center bottom of the gauge:
valueLabel.font = valueFont
valueLabel.text = "100"
valueLabel.translatesAutoresizingMaskIntoConstraints = false
addSubview(valueLabel)

NSLayoutConstraint.activate([
    valueLabel.centerXAnchor.constraint(equalTo: centerXAnchor),
    valueLabel.bottomAnchor.constraint(equalTo: bottomAnchor, constant: -20)
])
Bringing it to life
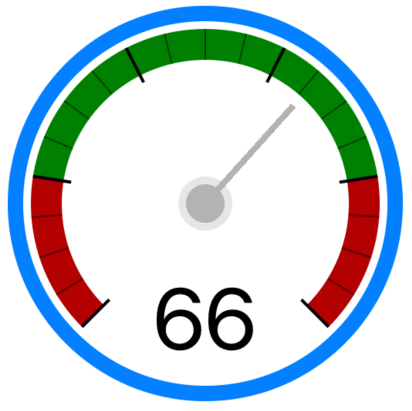
Now that we’ve drawn all the components for our gauge, the last part is relatively straightforward: we need to add a value property that updates the needle position and text label to reflect changes.
I’m going to make my gauge store a value between 0 and 100, which can then be mapped to the range 0 through 1 to decide where the needle ought to point. This will be done using a lerp – a linear interpolation – which will calculate an angle between the needle’s start and end angles based on the value that was passed in. So, if the start angle is 0 and the end is 200, and the value is 50 (i.e., half way), the lerp will return 100.
So, add this property now:
var value: Int = 0 {
    didSet {
        // update the value label to show the exact number
        valueLabel.text = String(value)

        // figure out where the needle is, between 0 and 1
        let needlePosition = CGFloat(value) / 100

        // create a lerp from the start angle (rotation) through to the end angle (rotation + totalAngle)
        let lerpFrom = rotation
        let lerpTo = rotation + totalAngle

        // lerp from the start to the end position, based on the needle's position
        let needleRotation = lerpFrom + (lerpTo - lerpFrom) * needlePosition
        needle.transform = CGAffineTransform(rotationAngle: deg2rad(needleRotation))
    }
}
That completes our gauge! All that remains now is to try out changing its value. This is best done using a delay so that the label updates correctly, so try adding this to viewDidLoad() in the ViewController class:
DispatchQueue.main.asyncAfter(deadline: .now() + 1) {
    UIView.animate(withDuration: 1) {
        test.value = 33
    }
}

DispatchQueue.main.asyncAfter(deadline: .now() + 2) {
    UIView.animate(withDuration: 1) {
        test.value = 66
    }
}

DispatchQueue.main.asyncAfter(deadline: .now() + 3) {
    UIView.animate(withDuration: 1) {
        test.value = 0
    }
}
Go ahead and run the code one last time, and you should see the label and needle change with the value – good job!
Where next?
I tried to make this control demonstrate a variety of techniques, but there’s still a lot more it can do. If you’re looking to take it further, try some of these:
- Make the label text animate up or down.
- Stop the needle from moving below its minimum position – a problem if you animate moving from value 0 to value 100.
- Go through all the methods and properties and mark as many as
privateas you can. - Make the class
@IBDesignableand@IBInspectableas much as is possible. - Add an
accessibilityLabelthat reads the value of the gauge to folks using Voiceover. - Make sure that changing properties triggers a redraw / update of the gauge.
And those are just to start with! Building a custom control is fun, but you soon realize the possibilities are almost endless – enjoy!
SPONSORED Join a FREE crash course for mid/senior iOS devs who want to achieve an expert level of technical and practical skills – it’s the fast track to being a complete senior developer! Hurry up because it'll be available only until April 28th.
Sponsor Hacking with Swift and reach the world's largest Swift community!